Business Charts Infographics 📊
Business Charts Infographics” PowerPoint templates are a collection of professionally designed, visually appealing templates that can help you present your business data and results in a more effective and engaging way. Here are some key features:
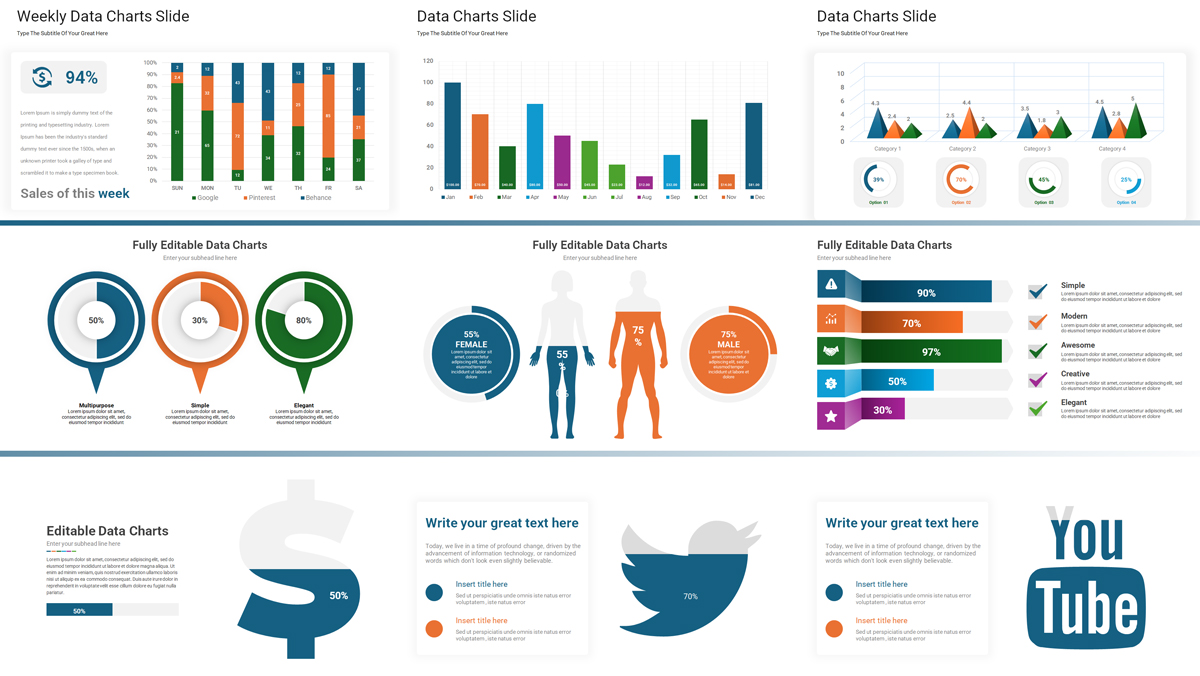
- Design 🎨: The templates include a wide range of designs such as hierarchies, arrows, hexagons, timelines, pie charts, bar graphs. This variety allows you to choose the most suitable template for your specific needs.
- Customizable 🛠️: These templates are fully customizable. You can add your own business logo and colours, upload or drag-and-drop images and icons, and spruce things up with charts and graphs.
- Professional Look 👔: The templates are clean and professional-looking, making them perfect for business presentations.
- Effective Communication 💬: The use of infographics in these templates allows you to showcase your content in a more visual way, making it easier for your audience to understand your topic.
- Versatile 🔄: Whether you’re sharing tips on how to run a business, outlining a business plan, or presenting complex data, these templates can help you get the job done.
These templates are ideal for anyone looking to improve their company’s performance and present their data and results easily. They are perfect for use as a Google Slides template, PowerPoint theme, or Canva template. 📈📊
Related Products
From multipurpose themes to niche templates