Annual Dashboard Report PowerPoint Template: Track Your Progress and Drive Success (35 Slides)
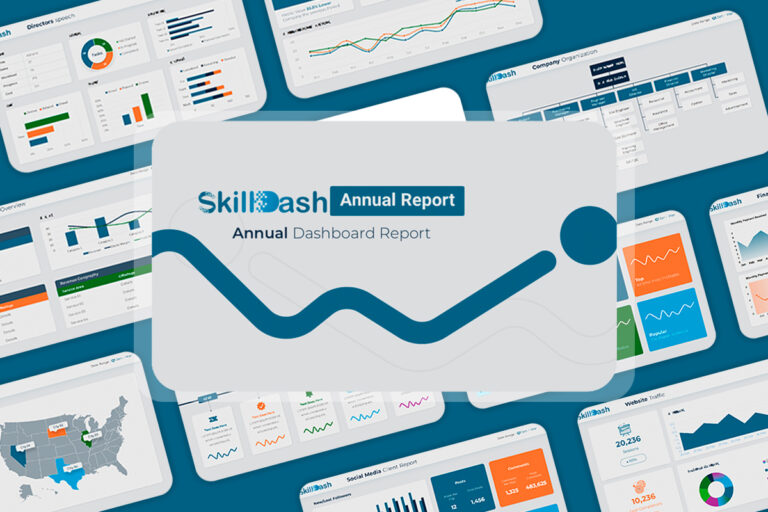
Elevate your annual reporting with our comprehensive Annual Dashboard Report PowerPoint Template. This dynamic presentation provides a holistic view of your company’s performance throughout the year, empowering you to analyze key metrics, identify trends, and make data-driven decisions for future growth.
Key Features:
- 35 Informative Slides: A comprehensive collection of slides covering financial performance, marketing initiatives, operational efficiency, and more.
- Customizable Dashboards: Visually stunning dashboards to track key performance indicators (KPIs), financial metrics, and progress towards goals.
- Data Visualization: Interactive charts, graphs, and tables to bring your data to life and highlight key insights.
- Trend Analysis: Identify patterns and trends over time to make informed strategic decisions.
- Financial Summaries: Concise summaries of revenue, expenses, profit margins, and other financial data.
- Marketing & Sales Performance: Track campaign results, customer acquisition, and sales growth.
- Operational Efficiency Metrics: Monitor productivity, resource utilization, and key operational indicators.
Benefits:
- Comprehensive Overview: Gain a 360-degree view of your company’s performance.
- Data-Driven Decision Making: Make informed decisions based on accurate and up-to-date data.
- Transparent Communication: Easily share performance insights with stakeholders.
- Strategic Planning: Identify areas for improvement and plan for future growth.
- Time-Saving: Eliminate the need to create reports from scratch.
Ideal For:
- Business Leaders: Track overall performance and make strategic decisions.
- Department Heads: Monitor team performance and align with company objectives.
- Investors & Stakeholders: Gain a clear understanding of the company’s financial health and growth potential.
- Board Members: Receive a concise and visually appealing summary of annual performance.
All Image Stocks not included.
Related Products
From multipurpose themes to niche templates